
Research Center
ALICE In Focus Series
Veterans in Financial Hardship
Because U.S. military veterans have served and sacrificed for this country, there is a national sense of responsibility to ensure that their basic needs are met. And overall, veterans have fared better economically than nonveterans. Yet not everyone has been included in that trend: In 2019, a substantial 4.6 million veterans — 27% — still struggled to make ends meet across the U.S.
According to the outdated Federal Poverty Level (FPL), 6% of veterans in the U.S. lived in poverty in 2019. But United For ALICE data shows that another 21% — more than three times as many — were also struggling, in households that earned above the FPL but less than what it costs to afford the basics. These households are ALICE: Asset Limited, Income Constrained, Employed.
Combining families in poverty and those who are ALICE, more than one-quarter (27%) of all veterans lived in a household with income below the ALICE Threshold in 2019, struggling to afford essentials in the communities where they lived.
The tabs below offer a more detailed view of veterans experiencing financial hardship.


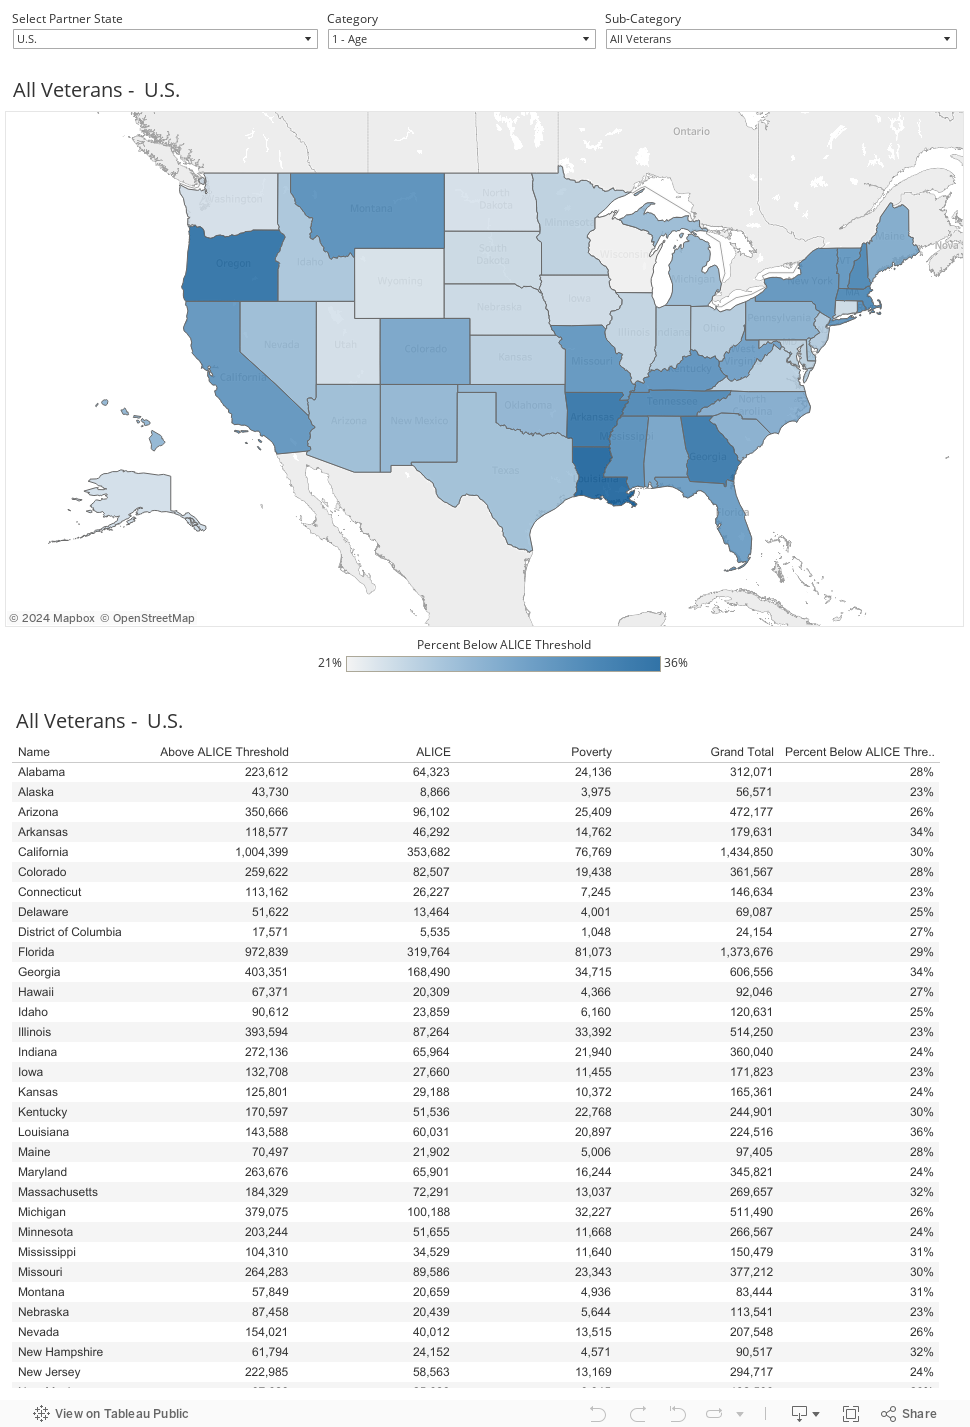
Local Maps
While there are veterans who are struggling financially in every community in the U.S., their demographics, household characteristics, and access to resources vary by location. The interactive map on this page shows the percentage of veterans below the ALICE Threshold in ALICE partner states by Public Use Microdata Areas (PUMAs) — a U.S. Census Bureau geography made up of groupings of about 100,000 people.
Use the drop-down menus below to view these demographics and household characteristics along with military bases (areas marked in gold) and Veterans Health Administration facilities (marked with red dots).
How to Use This Tool
- Select an ALICE Partner State or select 'U.S.' to see national data
- Select both a Category (like Age) and Sub-Category (like 5–17 Years). When a new category is first selected, the map will disappear until a new sub-category is selected.
- View the table below the map to see the number of veterans in each group by location
- Hover over the military bases (gold triangles) and Veterans Health Administration facilities (red dots) for more information about these locations.
Technical Details
- Sources: ALICE Threshold, 2019; U.S. Census Bureau, American Community Survey, PUMS, 2019 (latest available as of publication date). Veterans Health Administration facilities are based on the Veterans Administration Site Tracking system and military bases are from the National Transportation Atlas Database.
- Rounding: Percentages are rounded to whole numbers for ease of reading, which may result in percentages totaling 99% or 101%. Percentages in the ALICE Veterans Data Dashboard may differ +/- 1% from percentages included in the state and national Research Briefs due to rounding. Total numbers are presented in the Dashboard for calculation.
- Race/Ethnicity: All racial categories except Two or More Races are for one race alone, non-Hispanic. The Hispanic group may include veterans of any race.
- Sex: Sex includes the sex reported by the respondent for household members; the ACS only includes the options "male" or "female."
- Education The Educational Attainment category is based on the highest level of educational attainment and includes veterans age 25 and older.
- Work Status: The Work category includes veterans age 17–64.
- Selected Variables: All variables in this Dashboard come from the American Community Survey. To see how these variables are defined and named in this Dashboard, download the DATA DICTIONARY
- Missing Data and Grand Totals: Any group with fewer than 200 veterans is suppressed (not shown) to maintain accuracy and confidentiality. Grand totals exclude any sub-populations that are too small to display (sums in columns).